
Saturday marks 250 years since the Second Continental Congress voted to approve the Declaration of Independence. We hear a lot these days about how bad things have gotten in the United States. Just a couple years ago 59% of Americans
I’ll be honest, I really wanted to do a Miami Heat pun. Adebayo, Herro, and Powell are great but they just aren’t as recognizable as Luka Dončić [I won’t use the fancy Cs again]. The plan is to create a

I try to squeeze as much customization into my plots as I can, but the Matplotlib rabbit hole goes deep. Buried in the documentation you’ll find bizarre relics seemingly from a different world. Need a discrete colorbar with variable-width log-scale

I want to follow up on a previous post that used text as a scatter marker. It employed the TextToPath method to (as you might guess) convert text to Path, which is a Matplotlib class similar to an SVG. This
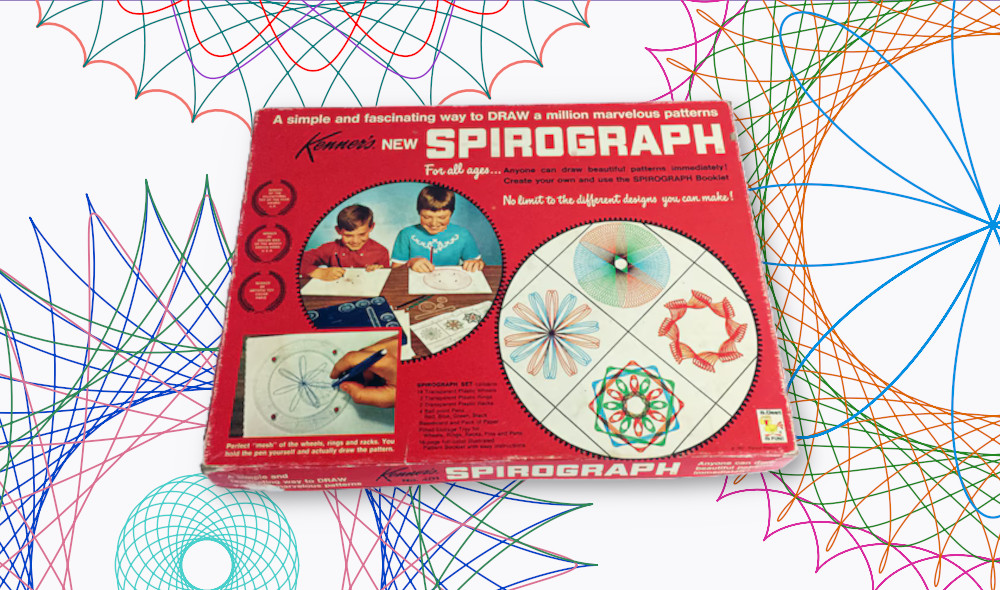
I used to love playing with these things as a kid. If you aren’t familiar, Spirograph is basically an art kit that lets you draw cool spiral shapes. Below is a demonstration from one of their commercials. I had the

It’s difficult to overstate how the United States has aged in recent decades. We have fewer kids, longer lifespans, and better medical care than ever. Those things aren’t bad per se, but they do present challenges for a program like

Scottie Scheffler has been ranked #1 on the PGA Tour for over three years now. In 2025 he won six tournaments, including two major championships. At this point hardly anyone disputes that Scheffler is the best golfer in the world.
I’ve wanted to post a Matplotlib 3D visualization for a while, but sharing it on the web is difficult. It’s easy to save 2D plots and embed them on this page. For a 3D plot, it works better when you

The Lotka-Volterra equations are a pair of differential equations used to model population dynamics. They assume an idealized environment with two species—one predator and one prey—and describe how the two populations change over time. The equations were developed simultaneously by

I think everyone knows what an ellipse is. It’s an elongated, squished circle that looks kind of like an egg. In mathematical terms it’s considered a conic section. That means you can slice through a cone and trace an ellipse,
View More